top of page

Roles
- Project Manager
- Product Designer - UX
- Visual Designer
- UX Researcher
Project Deliverables
- Managing Agile Code
- Wireframes
- Visual Designs
- Interactive Prototypes
- Design System
Tools
- Figma
- Zeplin
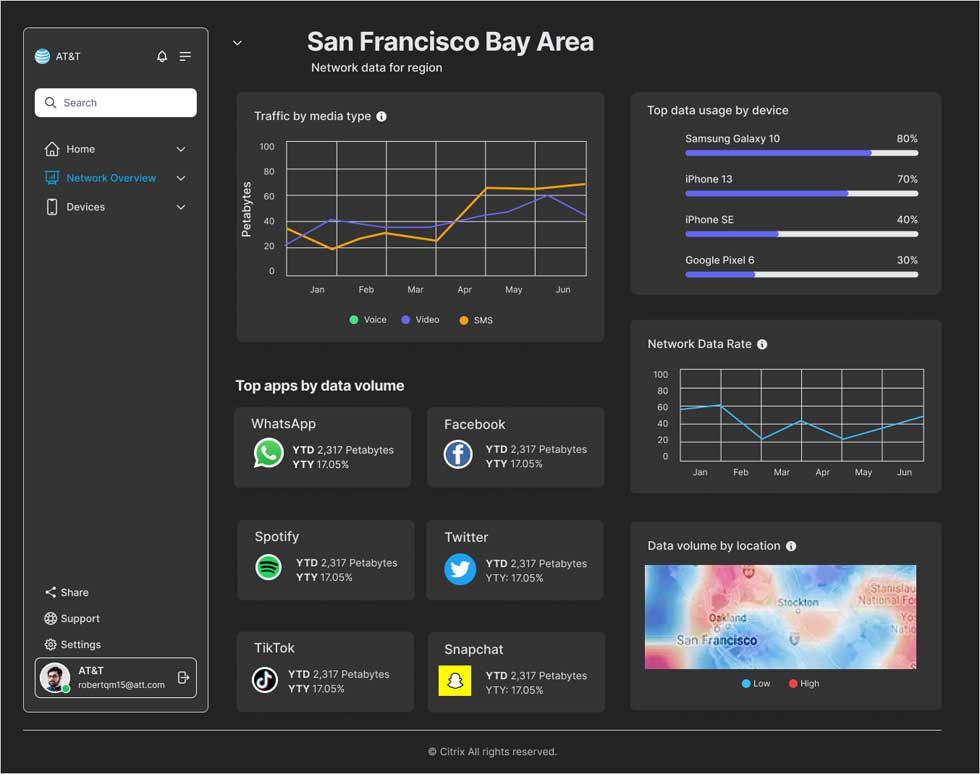
Final design
Below is one screen from the Network dashboard. The design process will be discussed in greater detail, later in this study.

Overview
Citrix and Bytemobile released an application that could run a deep dive into mobile phone networks. The system could provide information about: peak usage, the number of users on a network, the most popular phones, and more.
The problem
This information could only be viewed as a difficult to read text file.

The report could take days to run while pulling engineers off more important tasks.
Instead of taking days of engineering time, the CEO wanted these stats available visually in an instant.
Objectives and key results
Our objectives for this project were twofold.
Firstly we hoped to reduce the burden of sales engineers to run queries in an ad hoc manner for our target users.
Secondly, we wanted our user base to adopt the new solution with at a rate of at least 60%.
The design process
Step 01: Interviews
I interviewed middle and top tier management including CEOs at the different phone companies we served including T-Mobile and AT&T. I ran a total of 10 interviews.
We asked questions like:
- What network information interests you?
- What are your pain points with our current solution?
- What problems are you trying to solve with the info we provide?
Step 02: Affinity mapping
We ran an affinity mapping exercise to see how users organized data from our text file.
From here we discovered ways a dashboard could display data for our target audience.
Step 03: A closed card sort
Having derived basic categories from the affinity mapping exercise, I then asked subjects to organize features of the proposed dashboard based on their preferences.

Common categories included:
- Data Volume: Top apps on network
- Data Volume: Top devices on network
- Overall network health
Step 04: Adopting personas
Once the exploratory user interviews were complete, I distilled the study's findings into three personas.
These personas were used for the remainder of the project.
Personas were also introduced early on to executives as well as the Dev team.
The goal was to get our stakeholders to ask questions like:
"How would Michael use our app to look at bandwidth?"

Step 05: Run competitive analysis
For the dashboard, we concluded the we could benefit from different forms of visualization.
For this step, we looked at major players in data visualization.

Step 06: Sketch out ideas
Before creating mockups, I sketched out dozens of ideas.
I discussed these sketches with test subjects to see which ideas had the best traction.

Step 07: Wireframes
I created some low-fidelity wireframes of how the dashboard could be organized.
Navigation was based on buttons and links shown here in the left-hand margin.

Step 08: Color studies
Once I approached a final design with the team, I provided them with mockups that used a variety of color palates. In the end, we settled on using the light mode for the MVP.

Step 09: Final dashboard designs
The finalized dashboards below, use groupings based on findings from the affinity mapping exercise and similarity matrix run earlier.

Research
User testing took place in our office and by Zoom sessions with c-suite members around the country.
Takeaways
- Users found the designs much easier to navigate than the text file used earlier, (96%).
- Dashboard was easy on the eyes, (85%)
- Data Visualization and hierarchy of charts made sense for users, (92%).

Adoption
Following the release of version 1.0, end users were pleased, and our project had a
96% adoption rate.
The original text file system was phased out.
All users from this point onward, obtained their network KPIs from the new dashboard.
Savings
Our Engineers no longer had to manually retrieve data for customers.
This resulted in saving $1.3MM for the company, in our first year of deployment.
Thank You
Copyright © 2025 - Joe Wahrhaftig, All rights reserved
bottom of page